Appearance
ImPlot
Line plot from x/y arrays
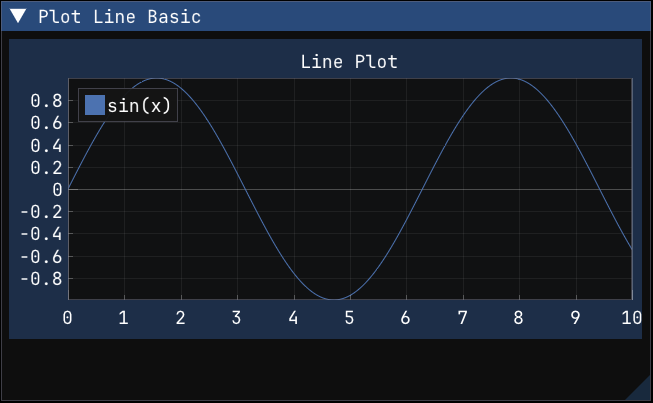
Plot a line from explicit x and y NumPy arrays.
This is the most direct implot.plot_line() calling pattern: prepare one array for x-coordinates and one array for y-values, then submit both arrays inside a begin_plot() / end_plot() block. Use this form when your x-axis is not just an implicit sample index and you want full control over the horizontal values shown in the plot.
python
def plot_line_basic():
    xs = np.linspace(0.0, 10.0, 200)
    ys = np.sin(xs)

    if implot.begin_plot("Line Plot"):
        implot.plot_line("sin(x)", xs, ys)
        implot.end_plot()
Line plot from values only
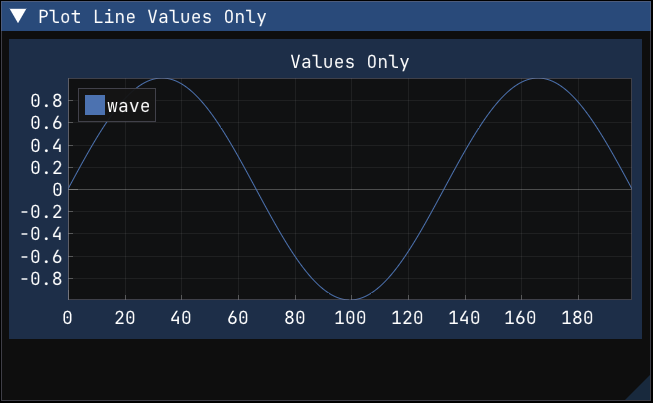
Plot a line from a single value array and let ImPlot infer the x-axis from the sample index.
This overload is useful when you only have y-values and want evenly spaced samples without creating a separate x-array yourself. It is a compact way to plot a waveform or time series when the natural x-coordinate is just "point 0, point 1, point 2, ...".
python
def plot_line_values_only():
    ys = np.sin(np.linspace(0.0, 3.0 * np.pi, 200))

    if implot.begin_plot("Values Only"):
        implot.plot_line("wave", ys)
        implot.end_plot()
Bar plot from values
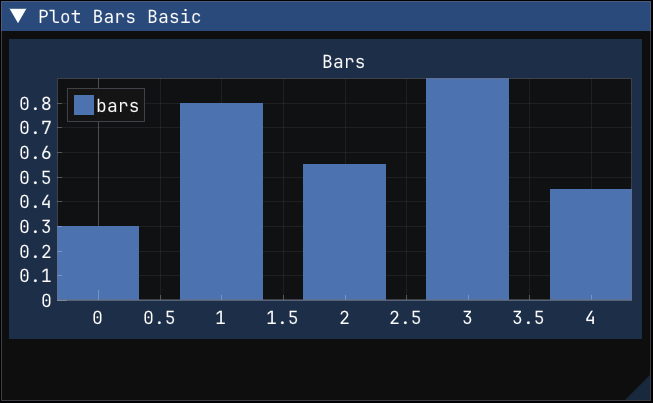
Plot bars from a one-dimensional NumPy array.
implot.plot_bars() can consume a single array of values and place each bar at the corresponding sample index. This is the simplest form for categorical or small summary data when you do not need custom x-positions for the bars.
python
def plot_bars_basic():
    ys = np.array([0.3, 0.8, 0.55, 0.9, 0.45], dtype=np.float32)

    if implot.begin_plot("Bars"):
        implot.plot_bars("bars", ys)
        implot.end_plot()
Grouped bar plot
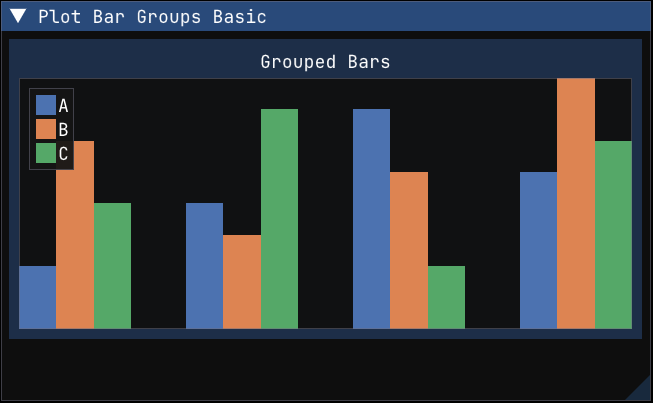
Plot grouped bars from a two-dimensional NumPy array.
implot.plot_bar_groups() expects tabular data where each row represents one labeled series and each column represents one group position. The call to setup_axes() removes axis decorations here so the grouped structure is easier to focus on in the example screenshot.
python
def plot_bar_groups_basic():
    values = np.array(
        [
            [0.2, 0.4, 0.7, 0.5],
            [0.6, 0.3, 0.5, 0.8],
            [0.4, 0.7, 0.2, 0.6],
        ],
        dtype=np.float32,
    )

    if implot.begin_plot("Grouped Bars"):
        implot.setup_axes(
            None,
            None,
            implot.AxisFlags.NO_DECORATIONS,
            implot.AxisFlags.NO_DECORATIONS,
        )
        implot.plot_bar_groups(["A", "B", "C"], values)
        implot.end_plot()
Scatter plot from x/y arrays
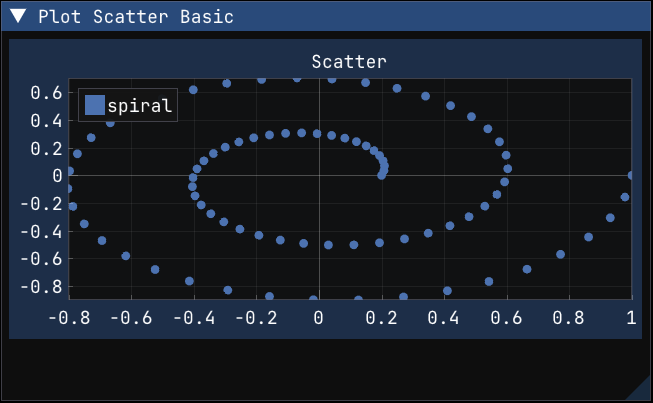
Plot scatter points from x/y NumPy arrays.
Scatter plots use the same explicit x/y array pattern as line plots, but render disconnected points instead of a continuous curve. This example builds a simple spiral from polar coordinates to show that the points do not need to lie on a regular grid or be evenly spaced.
python
def plot_scatter_basic():
    theta = np.linspace(0.0, 4.0 * np.pi, 80)
    radius = np.linspace(0.2, 1.0, 80)
    xs = radius * np.cos(theta)
    ys = radius * np.sin(theta)

    if implot.begin_plot("Scatter"):
        implot.plot_scatter("spiral", xs, ys)
        implot.end_plot()
Per-point marker color arrays with PlotSpec
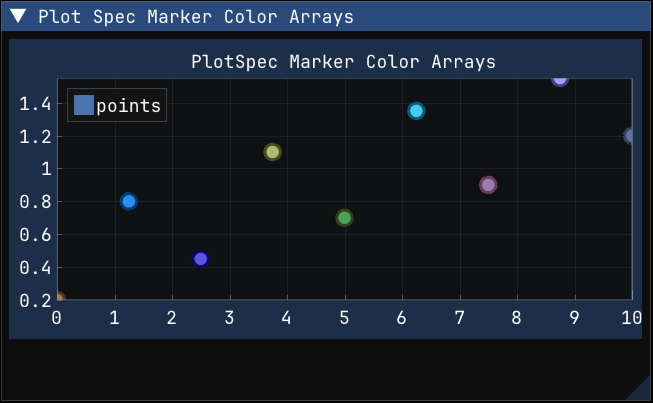
Use PlotSpec marker color arrays to style each scatter point with its own fill and outline colors.
Dear ImPlot 1.0 moved next-item styling into PlotSpec, including pointer-based arrays such as marker_fill_colors and marker_line_colors. This recipe shows the Python form of that pattern: attach NumPy arrays of packed uint32 colors to a PlotSpec, then pass that spec to a plotting call. The arrays stay attached to the PlotSpec, so the same object can be reused across frames and updated by mutating the NumPy arrays in place.
The example uses plot_scatter() because marker fill and marker outline colors are applied independently to each point. marker_fill_colors colors the marker interiors while marker_line_colors colors the outlines.
python
def plot_spec_marker_color_arrays():
    xs = np.linspace(0.0, 10.0, 9)
    ys = np.array([0.2, 0.8, 0.45, 1.1, 0.7, 1.35, 0.9, 1.55, 1.2], dtype=np.float64)
    marker_fill_colors = np.array(
        [
            0xFF4E79A7,
            0xFFF28E2B,
            0xFFE15759,
            0xFF76B7B2,
            0xFF59A14F,
            0xFFEDC948,
            0xFFB07AA1,
            0xFFFF9DA7,
            0xFF9C755F,
        ],
        dtype=np.uint32,
    )
    marker_line_colors = np.array(
        [
            0xFF1D3557,
            0xFF7A3E00,
            0xFF6A040F,
            0xFF184E4A,
            0xFF1B4332,
            0xFF7A5C00,
            0xFF5A3D66,
            0xFF8F3B4A,
            0xFF5C4033,
        ],
        dtype=np.uint32,
    )

    spec = implot.PlotSpec(
        marker=implot.Marker.CIRCLE,
        marker_size=8.0,
        line_weight=3.0,
        marker_fill_colors=marker_fill_colors,
        marker_line_colors=marker_line_colors,
    )

    if implot.begin_plot("PlotSpec Marker Color Arrays"):
        implot.plot_scatter("points", xs, ys, spec=spec)
        implot.end_plot()