Debugging C64jasm projects with VICE and C64Debugger
This is a tutorial on how to export debug info from projects compiled with c64jasm for use with VICE and C64Debugger.
C64jasm 0.9.1 added debug symbol output support for VICE and C64Debugger. The debug info files come in two flavors:
--vice-moncommands: VICE monitor commands file to show label names in the monitor.--c64debugger-symbols: KickAss debug symbols for C64Debugger. Maps program addresses to source locations enabling source level debugging.
Both flavors support setting breakpoints in the assembly source with the !break directive.
VICE monitor commands
To enable easier debugging with VICE, you can use the --vice-moncommands option to generate a program address to label name mapping script (moncommands). This script also includes break commands if any of the source files used the !break directive to set breakpoints.
Here’s how to output and use a moncommands script. You can try this with the c64jasm git repository or your own assembly project.
git clone https://github.com/nurpax/c64jasm.git
cd c64jasm/examples/content-pipe
Edit src/main.asm and add a !break as below:
+basic_start(entry)
;--------------------------------------------------------------
; Execution starts here
;--------------------------------------------------------------
entry: {
    !break          ; 👈 add breakpoint here!
    lda #0
    jsr music.init

    sei
    lda #$35        ; Bank out kernal and basic
    sta $01         ; $e000-$ffff
    +setup_irq(irq_top, irq_top_line)
    cli
Then compile the project:
c64jasm src/main.asm --vice-moncommands=main.vs --out main.prgThis produces two files: main.prg and main.vs. The contents of main.vs should look something like this:
al C:080d .entry
al C:0854 .entry::frame_loop
al C:0857 .entry::vsync
al C:0868 .animate_sprites
al C:086d .animate_sprites::anim_sprites
al C:0891 .animate_sprites::anim_sprites_x
[bunch of lines omitted..]
al C:20e8 .pet_rle::decode::decode_line::dst
al C:20f2 .background_petscii_rle
You can use these files in VICE like so:
x64 -moncommands main.vs main.prgIf everything went fine, VICE should break into the monitor at the start of the example project. Depending on your VICE build and configuration, you will see the monitor either in a separate window (preferred) or in the VICE C64 window like on my MBP:
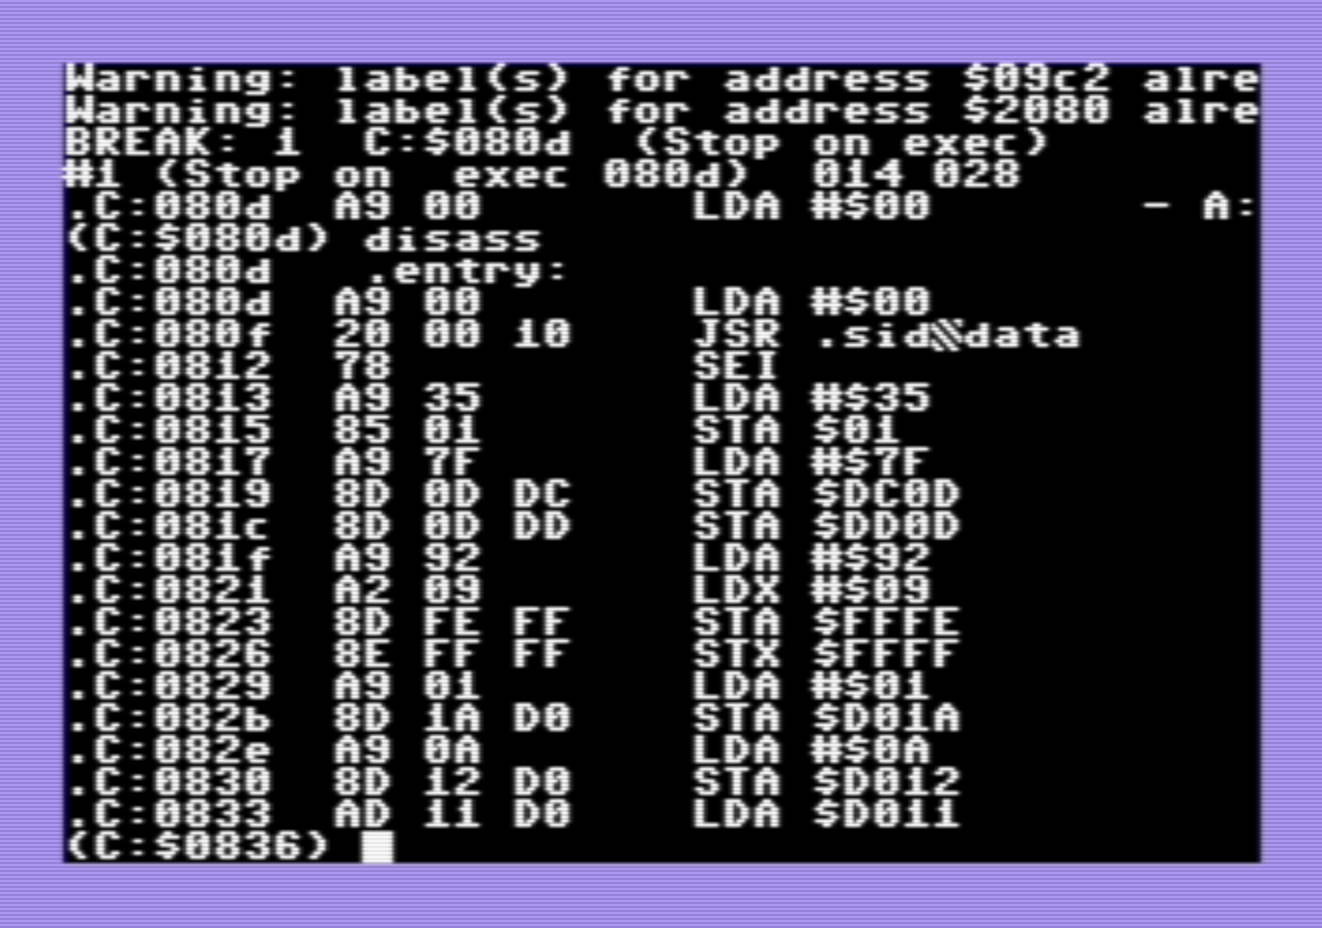
You can step through instructions with step, disassemble from the current program counter with disass or continue execution with g. (You should be able to enter the monitor also using a keyboard shortcut ALT-H but I keep pressing it and nothing happens. 🤷♀️)
C64Debugger and source-level debugging
Using the same example project from above, here’s how you will build the project and produce C64Debugger compatible debug symbols:
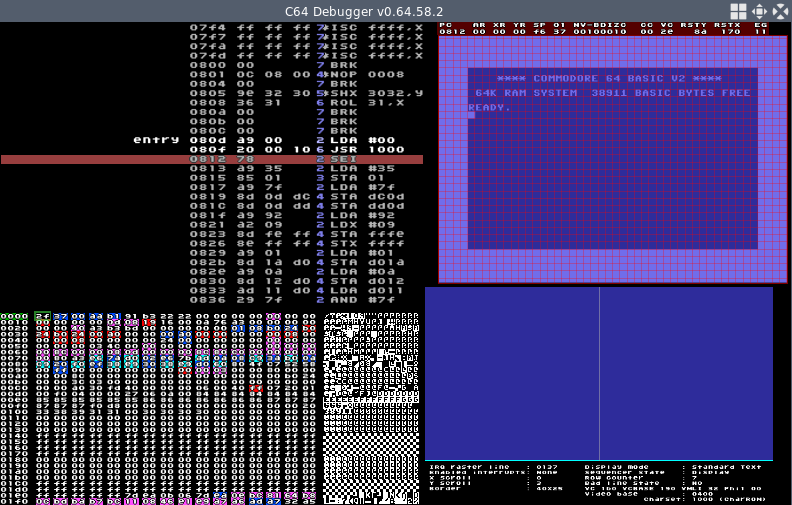
c64jasm src/main.asm --c64debugger-symbols=main.dbg --out main.prgYou can start C64Debugger with the below command. (It takes a bit of time for the debugger to start – there may be better way to run a .prg with C64Debugger.)
# This invocation assumes KickAss debug symbols reside in main.dbg, as generated
# above with c64jasm.

c64debugger -wait 2500 -autojmp -layout 9 -prg main.prg
C64Debugger should break at the start of the example project and you should see something like this:
This is where it gets interesting. C64Debugger supports source-level debugging so that you can see a side-by-side view of your program’s disassembly and original assembly source code. You can enter this mode with CTRL-SHIFT-F3 and your C64Debugger should show a view like this:
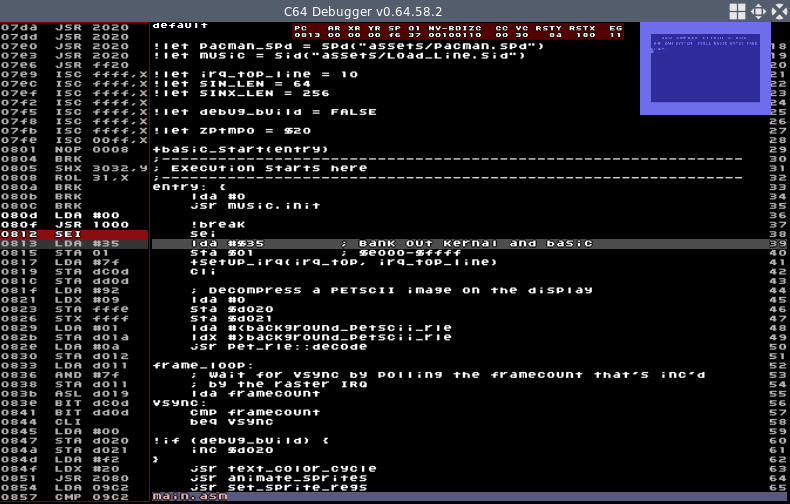
You can step through instructions by pressing F10 and continue execution with F11.
Here’s a nice summary of C64Debugger keyboard shortcuts: C64 Debugger shortcuts v06458.pdf. I couldn’t find this nicely formatted PDF from their project page.
This is it for this debug info tutorial. Happy debugging!